Synergy and Discounting of Cooperation in Social Dilemmas:
Well-mixed populations
by Christoph Hauert, Version 1.0, November 2005.
- Location:
- VirtualLabs
- » Social Dilemmas
- » Well-mixed populations
In well-mixed populations, the severity of the social dilemma is determined by the three parameters the cost-to-benefit ratio of cooperation c/b, the discount/synergy factor of accumulated benefits w, and the group size N. The dynamics of the system can be fully analyzed based on the replicator equation and results in four distinct dynamical regimes.
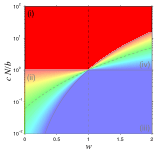
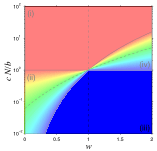
The four dynamical regimes together with the equilibrium fraction of cooperators are illustrated with two sections through the phase space spanned by the three parameters: N, c/b and w. The solid lines delimit the regions of all defection (red) and all cooperation (blue). Along the dashed line an interior fixed point exists and is x* = 0.5 (stable in region (ii), unstable in region (iv)). The dash-dotted line separates discounted (w < 1) and synergistically enhanced (w > 1) benefits. The equilibrium fraction of cooperators increases from none (red) to intermediate levels (yellow, green, light blue) to full cooperation (blue). In region (iv), the color indicates the size of the basin of attraction of the cooperative state (blue - big, red -small).

Social Dilemmas
Dynamical regimes and fraction of cooperators as a function of the cost-to-benefit-ratio c N/b and the discount/synergy factor w for N = 5.
Region (i): dominant defection; prisoner′s dilemma; public goods games.
Region (ii): co-existence; snowdrift type interactions.
Region (iii): dominant cooperation; by-product mutualism.
Region (iv): bi-stability; coordination problem.
The colors indicate the equilibrium fraction of cooperation which increases from none (red) to intermediate levels (yellow, green, light blue) and to full cooperation (blue). In region (iv), the color indicates the size of the basin of attraction of the cooperative state (blue - big, red -small).

Social Dilemmas
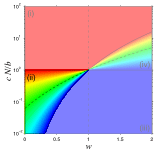
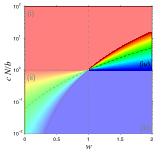
Dynamical regimes and fraction of cooperators as a function of the group size N and the discount/synergy factor w for c/b = 2/10.
Region (i): dominant defection; prisoner′s dilemma; public goods games.
Region (ii): co-existence; snowdrift type interactions.
Region (iii): dominant cooperation; by-product mutualism.
Region (iv): bi-stability; coordination problem.
The colors indicate the equilibrium fraction of cooperation which increases from none (red) to intermediate levels (yellow, green, light blue) and to full cooperation (blue). In region (iv), the color indicates the size of the basin of attraction of the cooperative state (blue - big, red -small).
 Click to enlarge Click to enlarge |
Social Dilemmas: cooperation versus c N/b and wPhase diagram depicting the equilibrium fraction of cooperators as a function of the cost-to-benefit ratio c N/b and the discount/synergy factor w for N = 5. In the case of discounting (w < 1) decreasing c/b facilitates cooperation and may lead to transitions from dominant defection (Prisoner's Dilemma) to co-existence of cooperators and defectors (Snowdrift games) and finally to dominant cooperation (by-product mutualism). Similarly, in the case of synergy (w > 1), increasing the benefits turns dominant defection into bi-stability and ends with dominant cooperation. Note that for w < 1 cooperators can only survive if c N/b < 1. This condition is not necessary for w > 1. Also note that co-existence requires w < 1 and bi-stability w > 1, whereas dominant cooperation or defection can occur for w greater, less or equal to one. Increasing N leaves the qualitative results unchanged and merely increases the slope of the boundary between co-existence and cooperation (defection and bi-stability) but it always runs through c N/b = w = 1. For N = 2 the boundary coincides with the dash-dotted line, whereas in the limit N → ∞ the boundary approaches the horizontal line such that regions (ii) and (iv) vanish. |
|---|---|
 Click to enlarge Click to enlarge |
Social Dilemmas: cooperation versus N and wPhase diagram depicting the equilibrium fraction of cooperators as a function of the group size N and the discount/synergy factor w for c/b = 2/10. Increasing w can favor cooperation by increasing the equilibrium fraction of cooperators (N < b/c) or the basin of attraction (N > b/c). Similarly, reducing the group size N facilitates cooperation by increasing the equilibrium levels (region (ii)) and basin of attraction (region (iv)). |
The robustness of these analytical results can be veryfied with individual based simulations of the dynamics in finite populations. The following sample scenarios should provide a convenient starting point for further explorations.
Different scenarios
All of the following examples and suggestions are meant as inspirations for further experimenting with the virtual lab. If your browser has JavaScript enabled, the following links open a new window containing a running lab that has all necessary parameters set as appropriate.
Legend | Evolution of cooperators and defectors in well-mixed populations where individuals interacting in social dilemmas with discounted or synergistically enhanced accumulation of cooperative benefits.
| |||
|---|---|---|---|---|
 |
Region (i): dominant defection (c N/b > 1, c N/b > wN-1)Cooperators are doomed and vanish regardless of their initial frequency. Note that for c N/b > 1, the minimal benefit secured by a cooperator (arising from its own act of cooperation) does not exceed the incurring costs of cooperation. This regime represents the strictest form of a social dilemma and corresponds to the prisoner's dilemma or, more generally, to public goods games. | |||
 |
Region (ii): co-existence (1 > c N/b > wN-1)Cooperators and defectors co-exist in a stable equilibrium mixture. In this case, the minimal benefits of cooperators can exceed the costs of cooperation whenever cooperators are rare. The dynamics always favors the rare type and thereby stabilizes co-existence of cooperators and defectors. This regime represents a generalized form of the snowdrift game for groups of arbitrary size. The social dilemma is relaxed because in groups of defectors it pays to switch to cooperation but groups of cooperators remain prone to exploitation by cheaters. Nevertheless, the social dilemma persists because a population in equilibrium has a lower payoff than a homogenous population of cooperators. | |||
 |
Region (iii): dominant cooperation (c N/b < 1, c N/b < wN-1)The social dilemma is completely relaxed such that cheating no longer poses a threat to cooperation. The minimal benefits returning to the cooperator from its own act of cooperation always exceed the incurring costs — irrespective of the group composition. However, note that nevertheless defectors continue to outperform cooperators in mixed groups, even though they could do even better by also switching to cooperation. In that sense, it remains a social dilemma and cooperation merely occurs as a by-product of an otherwise selfish act. | |||
 |
Region (iv): bi-stability (1 < c N/b < wN-1)In this regime, the two homogenous states with all cooperators and all defectors are both stable equilibria. A third, unstable mixed equilibrium exists, which separates the basins of attraction of the two stable fixed points. Thus, cooperators and defectors cannot invade each other and the evolutionary outcome depends on the initial configuration of the population. If the initial frequency of cooperators exceeds the mixed equilibrium, cooperation evolves but if not, cooperation vanishes, i.e. cooperation is only favored if it is already sufficiently abundant. The minimal benefits of a cooperator exceed the costs only if cooperators are already sufficiently abundant. In this case, the social dilemma presents itself as a coordination problem. |
In well-mixed populations, interaction groups of size N are randomly formed according to binomial sampling such that the fitness of cooperators and defectors becomes
fD = b/N (1- (1- x + w x)N-1) / (1- w),
where x denotes the frequency of cooperators. Recall that c are the costs of cooperation, b the publicly accessible benefit provided by one cooperator and w the synergy or discount factor which determines the actual value of accumulated benefits. The growth (or decline) of cooperators can then be described by replicator dynamics, where strategies spread that perform better than the population on average:
The replicator equation has two trivial fixed points x = 0 and x = 1 as well as potentially a third non-trivial equilibrium x* determined by the solution to fC = fD. The existence of x* in the interval (0, 1) and the dynamics of the system is determined by the cost-to-benefit ratio of cooperation c/b, the discount/synergy factor of accumulated benefits w, and the group size N. Variations of parameters changes the severity of the social dilemma. This results in four dynamical scenarios depending on whether the homogenous states of all defectors and all cooperators are stable or not (this follows because the system allows for at most a single interior fixed point 0 < x* < 1). In region (i) only the all defect state is stable and cooperation vanishes. In region (ii), both homogenous states are unstable and thus there exists a stable mixed equilibrium state x* where cooperators and defectors co-exist. In region (iii), all cooperation is the only stable equilibrium and defectors disappear. Finally, in region (iv), both homogenous states are stable, separated by an unstable interior fixed point x*. Thus, the system is bi-stable and the evolutionary outcome depends on the initial configuration.
For individual based models, Darwinian selection only requires that individuals with a higher fitness (payoff) have an increased propensity to proliferate and transmit their strategy either in terms of reproduction or through imitation by other individuals. Two particularly useful approaches are based on the replicator dynamics and on the Moran process.
Replicator dynamics in finite populations
In finite populations, one particularly simple implementation of the replicator dynamics considers a randomly selected focal individual that is updated as follows: first, the payoff of the focal individual is determined from an interaction in a randomly formed group of size N (including the individual itself). Second, a model individual is chosen at random and its payoff is determined in the same way. Finally, the two payoffs are compared and the focal individual adopts the model's strategy with a probability depending on the payoff difference.
There are numerous ways to determine the functional dependence of the updating probability. The most natural choices seem to be: (i) the probability is proportional to the payoff difference provided that it is positive and with probability zero otherwise; (ii) the probability is 1/2 for equally well performing models and increases (decreases) for better (worse) performing models, where the increase (decrease) could be linear or follow a step-like function such as the Fermi-function. In the first case, individuals never adopt strategies of worse performing players and thus stochastic effects are largely reduced. In fact, if the payoffs of both the focal and the model individual are determined over many interactions prior to payoff comparisons, this update rule becomes deterministic in direction but stochastic in time. In the limit of infinite populations and infinite neighborhood sizes this update rule recovers the replicator dynamics. This is also true for linear functions in the second case (but not for step-like functions).
Moran process
In the Moran process, a focal individual is randomly chosen for reproduction with a probability proportional to its fitness. As above, the fitness of each individual is determined from one interaction in a randomly formed group of N individuals. Then, another randomly chosen individual (independent of its fitness) is eliminated and replaced by offspring of the focal individual. Thus, all individuals have the same average lifespan but fitter individuals tend to have higher reproductive output. This represents a specific balance between selection and drift: fitter individuals have higher chances - but no guarantee - of reproduction, whereas less fit individuals are likely - but again, no guarantee - to be eliminated.
In principle, the fact that the Moran process has two absorbing states (either all cooperators or all defectors) prohibits any other stable equilibrium states. Practically, however, transient times often become exceedingly long such that properties of meta stable states become relevant.
Variations
Another interesting update rules would be an individual based variant of the best-response dynamics. This dynamics represent a myopic optimization process where an individual adopts the strategy that performs best for the current composition of the population. Moreover, variations of the updating process can be implemented for example by considering not just a single model member but, instead, do a more careful sampling of the current state of the population.
VirtualLab
The VirtualLabs applet consist of different components. Along the bottom there are several buttons to control the execution and the speed of the simulations. Along the top are of particular importance the Param button and the data views pop-up list. The former opens a panel that allows to set and change various parameters concerning the game as well as the population structure, while the latter displays the simulation data in different ways.
| Color code: | Cooperators | Defectors |
|---|---|---|
| New cooperators | New defectors |
| Payoff code: | Low | High |
|---|
Note: The different colors for sites that have updated their strategy are very useful to get an intuition of the activitiy in spatially structured systems. The shades of grey of the payoff scale are augmented by blueish and reddish shades, which indicate the payoffs for mutual cooperation and defection, respectively.
| Controls | |
| Params | Pop up panel to set various parameters. |
|---|---|
| Views | Pop up list of different data presentations. |
| Reset | Reset simulation |
| Run | Start/resume simulation |
| Next | Next generation |
| Pause | Interrupt simulation |
| Slider | Idle time between updates. On the right your CPU clock determines the update speed while on the left updates are made roughly once per second. |
| Mouse | Mouse clicks on the graphics panels generally start, resume or stop the simulations. |
| Data views | |
| Structure - Strategy | Snapshot of the spatial arrangement of strategies. Mouse clicks cyclically change the strategy of the respective site for the preparation of custom initial configurations. |
|---|---|
| Mean frequency | Time evolution of the strategy frequencies. |
| Structure - Fitness | Snapshot of the spatial distribution of payoffs. |
| Mean Fitness | Time evolution of the mean payoff of each strategy together with the average population payoff. |
| Histogram - Fitness | Histogram of payoffs for each strategy. |
Game parameters
The list below describes only the few parameters related to synergy and discounting in social dilemmas. Follow the link for a complete list and descriptions of all other parameters e.g. referring to update mechanisms of players and the population.
- Benefit:
- Total benefit b created by each cooperator and divided among all N members of the group (including the cooperator itself).
- Cost:
- cost of cooperation c (investment into common pool).
- Discount:
- synergy or discounting factor w determining the increase in value for accumulated cooperative benefits.
- Init Coop, init defect:
- initial fractions of cooperators and defectors. If they do not add up to 100%, the values will be scaled accordingly. Setting the fraction of cooperators to 100% (and the others to zero) results in a symmetrical initial configuration suitable for observing evolutionary kaleidoscopes.